
【本周写作预测】新鲜出炉🔥 可参考日期:8月2日-8月8日
1. 题目和图片
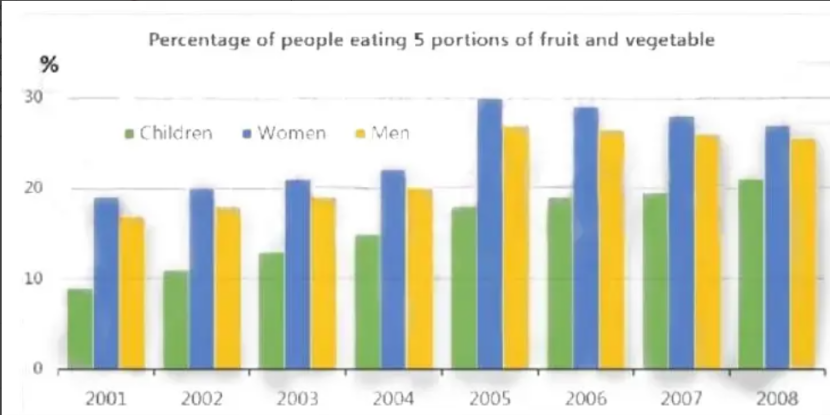
The bar chart below shows the percentage of people eating 5 portions of fruit and vegetable per day. Summarise the information by selecting and reporting the main features and make comparison where relevant
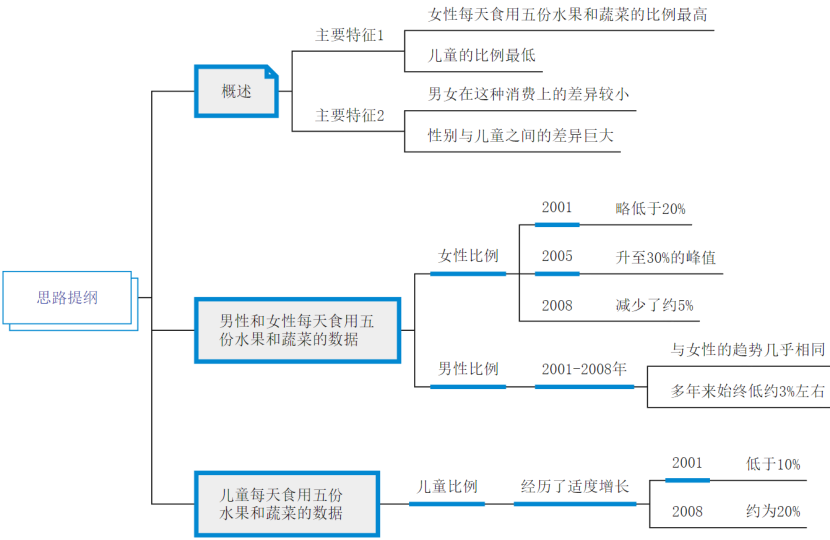
2. 思路提纲
3. 高分范文示例
The rate of individuals consuming five servings of fruits and vegetables daily over eight consecutive years is displayed in a bar graph.
Overall, throughout the period, the percentage of women having such consumption was the most considerable, whereas that of children was the least. Furthermore, the disparity between the figures for the two genders was minimal, whilst the margin between them and that for young ones was significant.
In particular, starting at marginally below 20%, the proportion of females who ate five portions of fruits and vegetables every day climbed to its peak of 30% in 2005 before it lessened by approximately 5% in the end. As for the rate of males doing the same, it followed a nearly identical trend during the period, but it was consistently lower by 3% or thereabouts.
When it comes to children, the level of those who consumed fruits and vegetables each day experienced a moderate growth between 2001 and 2008. It arrived at around 20% despite being merely below 10% at first.
4. 高分词汇或表达
(1) serving一份的量
(2) consecutive years连续的年份
(3) is displayed显示
(4) the most considerable最显著的
(5) disparity差异
(6) margin差距
(7) lessened减少
(8) nearly identical几乎相同
(9) In particular特别是
(10) or thereabouts或者大约
(11) When it comes to当谈到
(12) Experienced a moderate growth经历了适度的增长
(13) in spite of尽管
1. 题目和图片
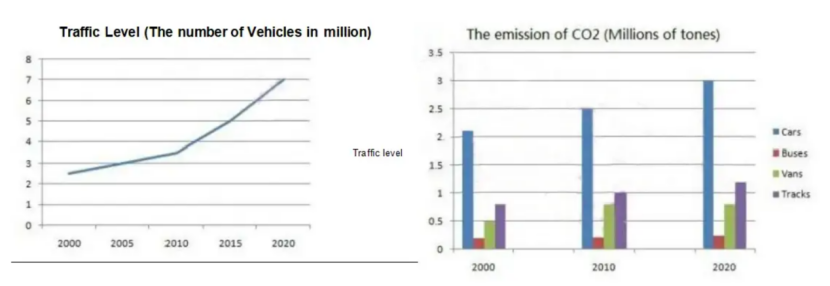
The chart and graph below show the change in traffic condition and the emission of CO2 in England and Wales between 2000 and2020
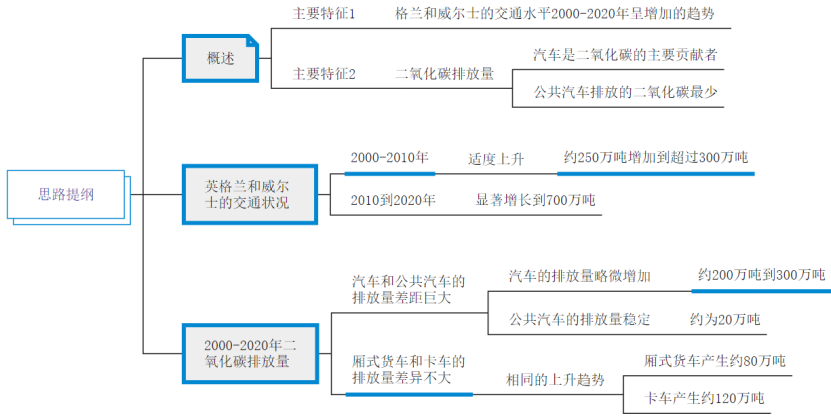
2. 思路提纲
3. 高分范文示例
The line and bar graphs illustrate the variations in the traffic situations and the discharges of carbon dioxide in England and Wales in years spanning two decades.
Generally, the traffic level in those places had an increasing inclination from 2000 to 2020. Moreover, cars were the biggest contributor of CO2 in the same period, with buses emitting the smallest amount.
Regarding the number of vehicles, it moderately went up from approximately 2.5 million to slightly above 3 million in the first 10 years. Nonetheless, it significantly grew to 7 million in the end.
As for the emissions of CO2, the figure for cars rose from marginally more than 2 million tons to 3 million tons, whilst that for buses was stable at roughly 0.2 million tons over the years. While the gap between the data of the previous productions was substantial, the difference between the levels of CO2 produced by vans and trucks was slight, sharing identical upward tendencies to around 0.8 million tons and 1.2 million tons in 2020, successively.
4. 高分词汇或表达
(1) variations变化
(2) discharges排放
(3) spanning two decades跨越二十年
(4) increasing inclination增加的趋势
(5) the biggest contributor最大的贡献者
(6) Regarding关于
(7) Nonetheless尽管如此
(8) significantly grew显著增长
(9) was stable稳定
(10) identical upward tendencies相同的上升趋势
(11) successively连续地
(12) previous productions以前的作品
(13) was substantial是实质性的