本周小作文写作预测新鲜出炉🔥 可参考日期:11月8日-14日
1、题目和图片
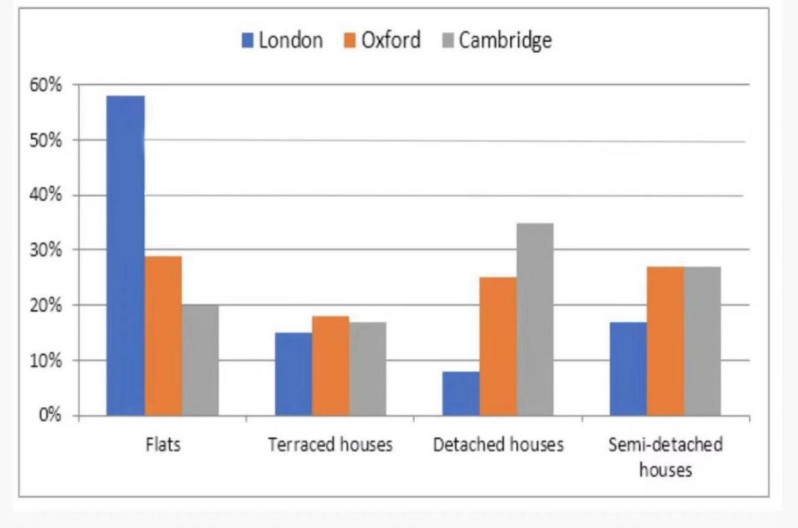
The following chart illustrates the results of a British survey taken in 2005 related to Housing preferences of UK people.
Summaries the information by selecting and reporting the main features, and make comparisons where relevant.
Write at least 150 words.
2、思路提纲
3、高分范文示例
The bar graph illustrates the outcomes of a study in 2005 regarding the types of
residences British residents in three districts opted for.
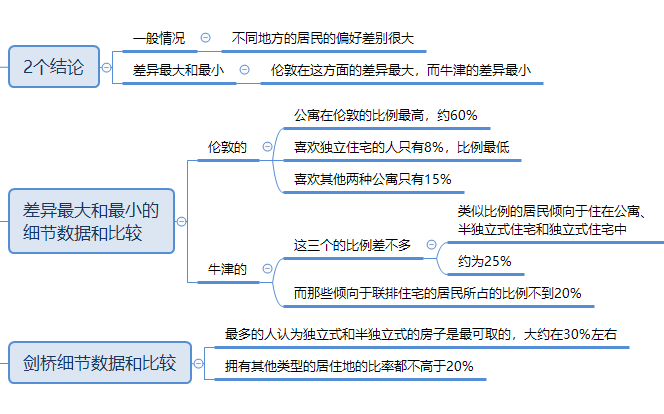
Generally, the predilections of inhabitants of the various places varied considerably.
London displayed the biggest disparities in terms of their preferences, whilst Oxford
exhibited the smallest differences.
Specifically, flats had the highest percentage in London, reaching about 60%, in
comparison to merely around 8% of those who liked detached houses, the lowest
figure, and approximately 15% of individuals who favoured the other two kinds. In
Oxford, similar proportions of residents were inclined to live in flats, semi-detached
houses, and detached ones, being around 25%, while those who were partial to
terraced homes made up less than 20%.
As for people residing in Cambridge, the most sizeable figures thought that detached
and semi-detached houses were the most preferable, at 30% or thereabouts, each.
However, the rates of those who would rather have the other types of living place
were both no higher than 20%.
Word Count: 166
4、高分词汇或表达
1. Outcomes n. 结果( outcome的名词复数 )
2. Regarding prep. 关于;就…而论;至于
v. regard的现在分词
3. Districts n. 地区( district的名词复数 );(为行政、司法、选举、教育等目的而划分的国家、州或县的)区;选区;英国教区的分区
4. Opted for已选项
5. Predilections n. 偏爱,偏好,嗜好( predilection的名词复数 )
6. Inhabitants n. 居民,住户, (栖息在某地区的)动物( inhabitant的名词复数 )
7. Exhibited v. 陈列,展览( exhibit的过去式和过去分词 );表现;显示;[法律]当庭出示(证件、物证等)
8. Favoured adj. 受优惠的,有特权的
9. Inclined adj. 倾斜的;倾向的
v. (使)倾斜( incline的过去式和过去分词);(使)偏向
10. Partial adj. 部分的;偏袒的;钟爱的
11. The most sizeable 规模最大的
12. Preferable adj. 更好的,更可取的;略胜一筹的
13. Thereabouts adv. (地点、时间、数量等)大约;上下;附近;左右
14. Would rather 宁愿, 宁可
1、题目和图片
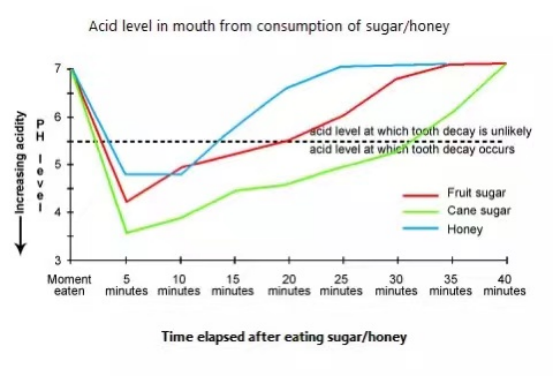
Eating sweet foods produces acid in the mouth, which can cause tooth decay. (High acid levels are measured by low pH values).
Summaries the information by selecting and reporting the main features, and make comparisons where relevant.
Write at least 150 words.
2、思路提纲

3、高分范文示例
The line chart illustrates the acid level in the mouth after ingesting sweet food, which
could be detrimental for the teeth.
Overall, the span of time the pH level in the mouth is at the high risk of tooth decay is
the shortest after the intake of honey. In contrast, it is the longest after eating cane
sugar, which means that the latter kind has the most adverse impact on dental health.
Specifically, within 5 minutes of consumption of any of these sweeteners, the acid
level declines to the extent when tooth decay is possible, which is below 5.5, with that
of cane sugar reaching the lowest of about 3.5. By comparison, the pH level after the
intake of honey does not go beyond approximately 4.8. After levelling off for another
5 minutes, it starts to climb back to the safe zone, achieving only an accumulated
time of roughly 13 minutes. With respect to the other two, lengthier timescales
transpire before this occurs, with the time lapse after eating fruit sugar being 20
minutes or thereabouts and that following consuming cane sugar reaching almost 32
minutes.
Word Count: 186
4、高分词汇或表达
1. Ingesting v. <正>吃,吞下( ingest的现在分词 );获取(某事物)
2. Detrimental adj. 有害的,不利的
3. Intake n. 吸入,进气;(液体等)进入口;摄入,摄取;纳入(数)量
4. The most adverse 最不利的
5. Impact n. 影响;作用;冲击力
v. 对…有影响;冲击;撞击
6. Go beyond 超出, 超载;逾
7. Accumulated time 累积时间
8. With respect to 关于, (至于)谈到
9. Lengthier adj. 长的,漫长的,啰嗦的( lengthy的比较级 )
10. Timescales n. 时间表[尺度],时标,时间量程( timescale的名词复数 )
11. Transpire vi. 蒸发;泄露;(事情)发生
vt. 使蒸发;使排出;[医]发汗;(秘密)被泄漏
12. Time laps时间圈
13. Thereabouts adv. (地点、时间、数量等)大约;上下;附近;左右
1. 题目和图片
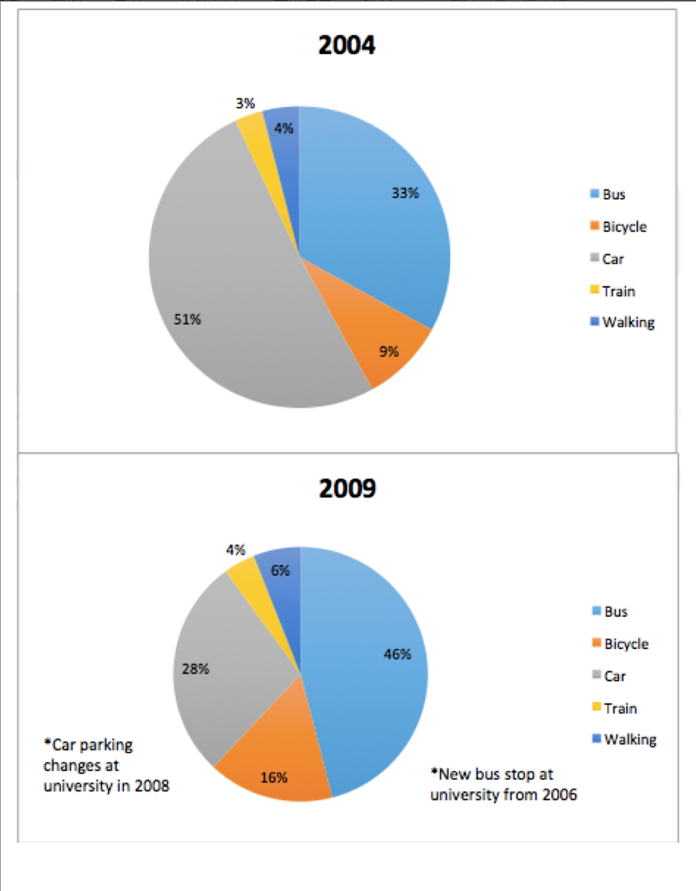
The following pie charts show the main modes of transportation people used to travel
to university for work or study in 2004 and 2009. Please judge and select the key
information in the chart and summarize it. If the information is related, please make
the necessary comparison. You should write at least 150 words.
2. 思路提纲
3. 高分范文示例
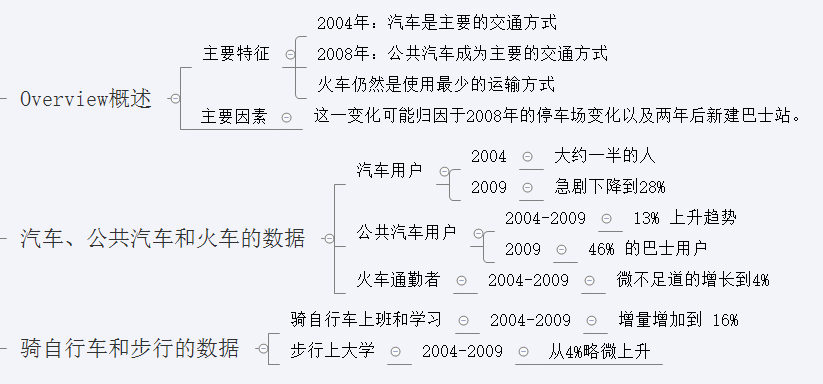
The pie charts compare the disparate means of transport for individuals going to a university for work or learning purposes spanning half a decade.
Generally, the primary mode of traveling to the aforementioned destination differed,
with it being cars in 2004 and buses in 2009, and the change could be attributed to
the car park changes in 2008 and a new bus stop two years prior to that. On the
contrary, trains remained the least utilized method of transportation.
To be specific, roughly half of the people proceeding to the campus drove cars in
2004, but the figure drastically lessened to merely 28% in 2009. By contrast, there
was a noticeable uptrend amounting to 13% in the share of those using buses to 46%.
Concerning the data of train users, it had a trivial growth to 4%.
In addition to previously stated means, riding a bicycle and walking to the university
were also done by workers and students. The percentages of both became more
sizeable, with the former experiencing a comparatively greater level of increment to
16%, whilst the latter ascended marginally from 4%.
Word Count: 184
4. 高分词汇或表达
(1) Disparate不同
(2) Spanning生成
(3) Aforementioned上述的
(4) Attributed由于
(5) Prior事先
(6) Campus校园
(7) Lessened减轻
(8) Uptrend趋势
(9) trivial琐碎
(10) More sizeable更可观
(11) Comparatively比较
(12) Increment增加


