本周小作文预测新鲜出炉🔥可参考日期:1月3日-1月9日
1. 题目和图片
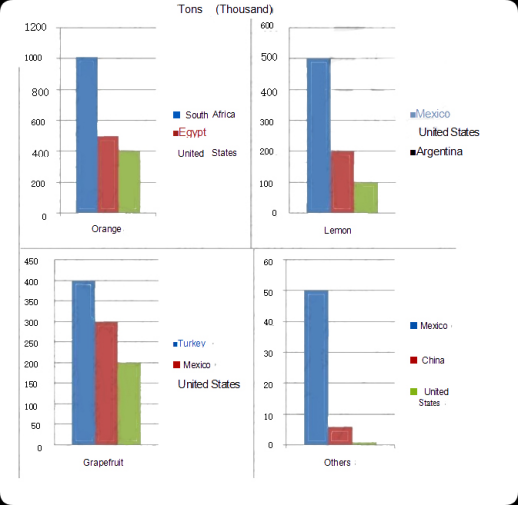
The bar chart below shows four types of fruits and the amount exported to different countries in 2012
2. 思路提纲
3. 高分范文示例
Given are bar graphs that illustrate the data of a variety of fruits that were traded to disparate nations in 2012.
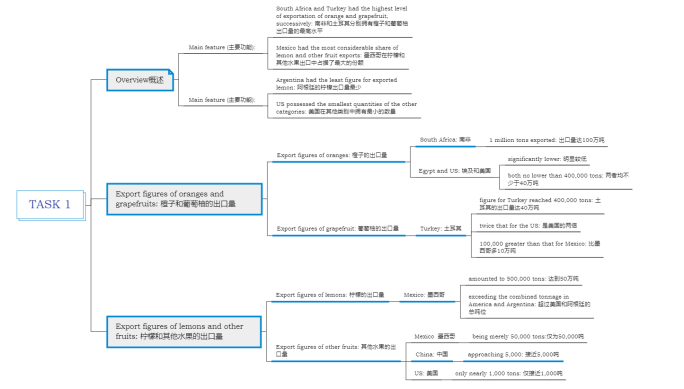
Generally, South Africa and Turkey had the highest level of exportation of orange and grapefruit, successively, whereas Mexico had the most considerable share of lemon and other fruit exports. On the contrary, except for lemon, in which Argentina had the least figure, the US possessed the smallest quantities of the other categories.
When it comes to oranges, the amount exported to South Africa was 1 million tons, significantly more than those sold to Egypt and the United States, which were both no lower than 400,000 tons. As for grapefruit, the figure for Turkey reached 400,000 tons, twice that for the US and 100,000 greater than that for Mexico.
By comparison, the exported lemon to Mexico amounted to 500,000 tons, even exceeding the combined tonnage of this kind of citrus exported to America and Argentina. Comparatively, smaller figures for other fruits were sold internationally, with that of Mexico being merely 50,000 tons and those of China and the US only approaching 5,000 and nearly 1,000 tons, correspondingly.
Word Count: 187
4. 高分词汇或表达
(1) a variety: 各种
(2) disparate nations: 不同的国家
(3) exportation: 出口
(4) successively: 分别
(5) the most considerable share: 最大的份额
(6) except for: 除了
(7) possessed: 拥有
(8) When it comes to: 提到
(9) no lower than: 不低于
(10) exceeding: 超过
(11) kind of citrus: 一种柑橘类水果
(12) the combined tonnage: 总吨位
(13) Comparatively: 相对而言
(14) Merely: 仅仅
(15) twice that: 两倍
(16) By comparison: 相比之下
(17) correspondingly: 相应地
(18) approaching: 接近
1、题目和图片
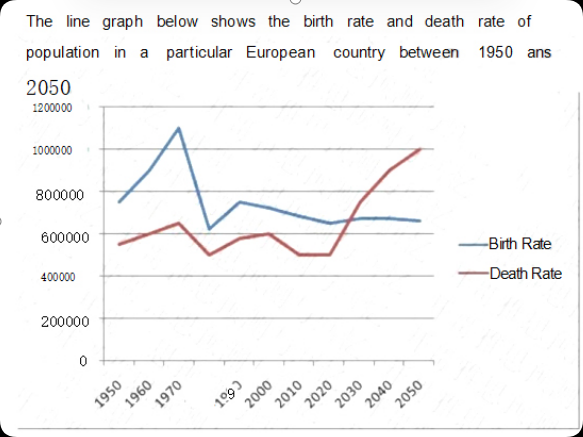
The line graph below shows the birth rate and death rate of population in a particular European country between1950 ans 2050
2、思路提纲
3、高分范文示例
Given is a line chart that compares the natality and mortality rate of a certain nation in Europe over a century, spanning from the past to the future.
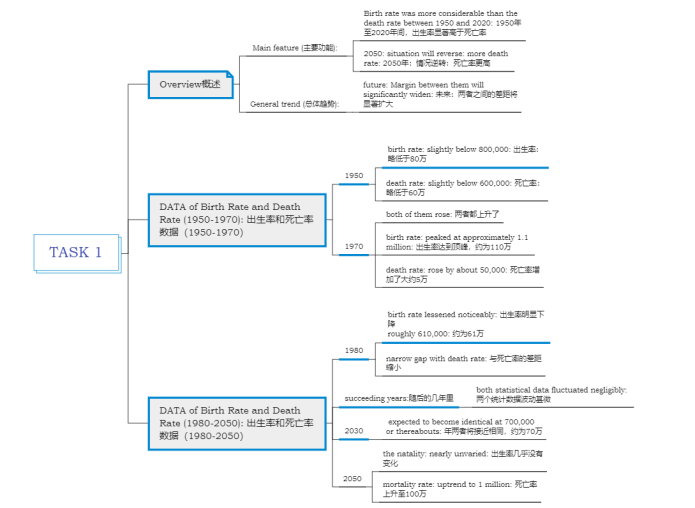
All in all, the birth rate was more considerable than the death rate between 1950 and 2020; nonetheless, the situation reversed after that year, and it will be maintained till 2050. Furthermore, the margin between them will significantly widen.
To be specific, in the initial year, the birth and death levels were slightly below 800,000 and 600,000, successively. In the next two decades, both of them rose, at varying scopes, with the former soaring to its peak of approximately 1.1 million and the latter rising marginally by about 50,000.
Ten years later, the birth rate lessened noticeably to roughly 610,000, narrowing its gap with death rate. Their statistical data fluctuated negligibly until they are expected to become identical at 700,000 or thereabouts in 2030. However, in the subsequent years, the natality will still be nearly unvaried, whereas the mortality rate is projected to experience an uptrend to 1 million in the final year.
Word Count: 179
4、高分词汇或表达
(1) natality: 出生率
(2) mortality rate: 死亡率
(3) more considerable: 更显著
(4) nonetheless: 尽管如此
(5) reversed: 逆转
(6) margin: 差距
(7) will significantly widen: 将显著扩大
(8) successively: 连续地
(9) varying scopes: 不同范围
(10) lessened: 减少了
(11) soaring to its peak: 飙升至顶峰
(12) statistical data: 统计数据
(13) negligibly: 微不足道地
(14) unvaried: 无变化
(15) are expected to become identical: 预计将相同
(16) or thereabouts: 或大约
(17) is projected to experience: 预计将经历
(18) uptrend: 上升趋势
1、题目和图片
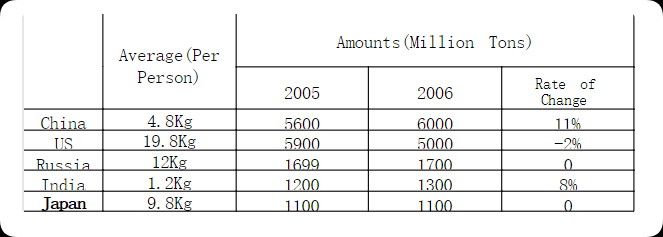
The table below shows information about the CO2 production released by five countries that produced the most in 2006
2、思路提纲
3、高分范文示例
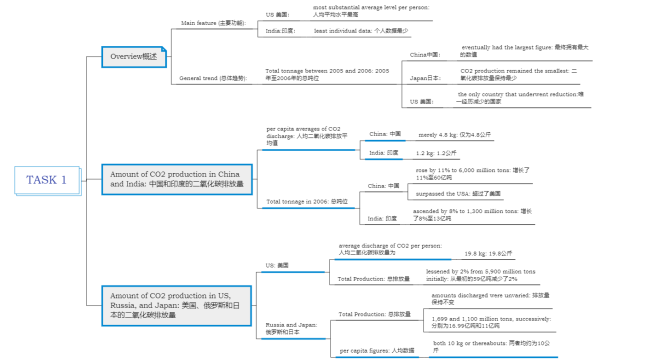
The chart compares various nations in terms of carbon dioxide emitted to the atmosphere in 2006.
Overall, despite having the most substantial average level per person, the US was the only country that underwent reduction. Contrarily, the least individual data belonged to India. Concerning the total tonnage, China eventually had the largest figure, whereas Japan’s CO2 production remained the smallest between 2005 and 2006.
Specifically, the per capita averages of CO2 discharge in China and India were merely 4.8 kg and 1.2 kg, respectively. However, these two countries experienced the highest levels of increment in the total tonnage, with the former rising by 11% to 6,000 million tons and surpassing the USA, and the latter ascending by 8% to 1,300 million tons.
On the other hand, although the average discharge of CO2 per person of the US was 19.8 kg, its total declined by 2% in the given scale of time from 5,900 million tons initially. The amounts discharged in Russia and Japan were unvaried at 1,699 and 1,100 million tons, successively, and their per capita figures were both 10 kg and thereabouts.
Word Count: 183
4、高分词汇或表达
(1) emitted: 排放
(2) the atmosphere: 大气
(3) despite: 尽管
(4) underwent: 经历
(5) reduction: 减少
(6) Contrarily: 相反
(7) Concerning the total tonnage: 关于总吨位
(8) eventually: 最终
(9) increment: 增加
(10) On the other hand: 另一方面
(11) ascending: 上升
(12) declined: 下降
(13) the given scale of time: 给定的时间范围
(14) discharged: 排放
(15) unvaried: 不变的
(16) most substantial average level: 最大的平均水平
(17) Specifically: 具体而言
(18) the per capita averages: 人均平均值
(19) experienced the highest levels: 经历了最高水平
(20) successively: 相继
(21) or thereabouts: 或左右
(22) discharge of CO2: 二氧化碳排放

